Diagnosing and Resolving faults in an ST 2110 IP Video network requires comprehensive root-cause analysis. Monitoring by exception and a seamless transition to IP diagnostics tools can significantly improve your ability to do it. It does not matter whether a fault results from IP errors or from some type of deterioration to, or glitch in, the program essence elements like video, audio, or data. All that matters to a viewer, and thus to your business, is rapid resolution.
Things Were Simpler…
Quickly diagnosing and resolving both IP and video issues is a fundamental value provided by a media analysis platform like PRISM. When you are performing a deep-dive analysis of an individual signal chain or a few programs within an IP-based media facility, a Waveform Monitor/Network Analyzer is all you need.
…But Complexity Overtook the Media Industry
But, the cases where you have a limited number of signal paths to worry about are becoming fewer over time. What happens when you have hundreds of programs and thousands of signal paths with which to concern yourself? Engineers using waveform monitors alone will find this a difficult, if not insurmountable, challenge.
IP is More Flexible But Also More Difficult to Diagnose
In an IP video network, it is possible to have complete visibility of what is happening on your network. When we built SDI-based plants, monitoring everything was not practical because the cost of routing signals just for monitoring was prohibitive. Of course, it was easier to diagnose SDI issues because you could just trace a point-to-point signal path to isolate a problem. You cannot do this in an IP environment because there are no longer separate point-to-point pipes and things are less orderly and non-deterministic.
With IP it’s possible to have visibility of everything but with so much data doing so is essentially impossible without the right tools. It is that visibility we provide with Inspect 2110. To effectively monitor all of your contribution and distribution feeds you need an appropriate model of doing so. Simultaneously overseeing multiple programs is best done through monitoring by exception, which is exactly the power of Inspect 2110.
Isolating Problems Through Monitoring By Exception and Looking Only at Anomalies
Among myriad signals, you need to quickly identify the few problematic instances so you can focus specifically on them. This you can do by augmenting your Waveform Monitor/Network Analyzer with a probe capable of monitoring many streams and notifying you quickly when a specific signal exhibits behavior that is an exception to what is expected. The monitoring of many streams (say, contribution feeds) occurs in the background and the only time your engineering team must be concerned is when something goes wrong. Human productivity is optimized because your people need not worry about everything that’s working fine – their brainpower can be devoted to quickly resolving the errors that occur. That’s why broadcasters need monitoring.
A Heritage of Monitoring and Broadcast Experience
When it comes to this type of monitoring, Telestream has a distinct advantage with Inspect 2110. The design of this solution leverages the Telestream heritage of expertise in monitoring large volumes of program streams. That, together with our deep insights into the needs of broadcast monitoring, led us to develop an exception-based probe that meets the specific requirements of broadcast and media production users. Together with PRISM, Inspect 2110 delivers a complete solution to the monitoring and troubleshooting needs of content creators, producers, and broadcasters. By coupling the Inspect 2110 monitoring probe and the advanced diagnostics tools in PRISM into a seamless user experience, Telestream offers a complete system for managing and maintaining today’s increasingly large and complex media networks.
How Does the Inspect 2110 Probe Handle Monitoring By Exception?
Inspect 2110 monitors all, or any subset, of the signals in your facility and the user interface will display a thumbnail video with a Red/Green status indicator for each. By quickly looking at the UI, the user can immediately determine whether signals are functioning properly (Green) or not (Red).

You are not just supplying video content. You also deliver one or more channels of audio, and ancillary data. To avoid having to examine each essence type separately, video, audio, and data essence from the ST2110 streams are combined and the Red/Green indicators aggregate the status of the whole collection.
If a signal or group of related ones is “red”, the user can instantly list the associated alarms simply by hovering the mouse over the small moving image that represents it. Attention is focused on signals or groups that have issues rather than overwhelming the user with data. Within myriad network packets, there is a wealth of information related to each and essence stream. Inspect 2110 provides alerts that allow the operators and engineers to zero in on specific issues, narrow the focus of the problem, and provide a quick resolution.
Inspect 2110 also logs alarms and the logs can easily be sorted. Over time it is easy to see the timestamp of alarm occurrence, as well as error duration and more. This simplifies the processes of trend analysis and of identifying recurrent problems.
The PRISM Media Analysis Platform is a Waveform Monitor/Network Analyzer That Lets You Dive Deep
Monitoring by exception and seamless transition to IP diagnostics tools are crucial requirements for a complete solution. For example, when Inspect 2110 has identified an issue it provides a number of tools that you can use to understand it. But, when the time comes to deeply dive into issues like primary and secondary stream mismatches, buffer over- and underflows, and PTP problems, you need additional tools.
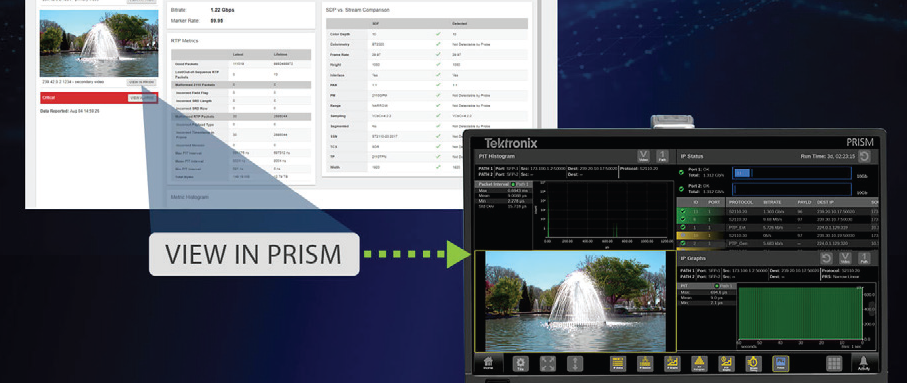
To make accessing those tools seamless, Inspect 2110 provides a quick “View in PRISM” feature that allows the required information relative to the program streams to be directly configured to a specified PRISM.

This simplifies configuration and allows you to quickly investigate the issue using a wide array of diagnostic tools. Without the PRISM interface – for example if you used a product from another manufacturer – you’d need to write down all the details of the stream(s) that you must dive into from the Inspect 2110 and then manually enter them into the media analysis tool. That is quite a bit of work and certainly prone to errors.
With PRISM as your diagnostic tool, an operator or engineer can investigate further by simply selecting the stream or bundle of essences and clicking a button labeled “view in PRISM”. The PRISM will automatically be configured to explore the selected stream(s).
Once Inspect 2110 sends a problematic ST2022-6 or ST2110-20 video stream, an ST2110-30 audio stream, and/or an ST2110-40 ancillary data stream (or a bundle thereof) to PRISM we decode it/them and can diagnose problems deep within the video, audio, or data through PRISM’s IP analysis tools.

Telestream provides a number of resources related to monitoring by exception and seamless transition To IP diagnostics.
To learn more about Inspect 2110 and monitoring by exception visit our webpage here.
To learn more about the PRISM Media Analysis Platform and the whole Waveform Monitor family click here.
To read more about diving deep with the PRISM Waveform Monitor/Network Analyzer check out these earlier posts:
IP Video: Waveform Monitors Diagnose Packet Jitter
IP Video: Using PIT Histograms to Diagnose Timing with a Waveform Monitor
IP Video: Analyzing Stream Timing with a Waveform Monitor